With the legalization of cannabis in Canada and in many US states, the need to quantify potency of cannabis has become more urgent. If the cannabis is used for medicinal purposes, CBD needs to be measured. On the other hand for recreational purposes, THC needs to be measured. It is hard to imagine having another medicine whose dosage is not accurately measured and then prescribed? There are many variabilities for cannabis grown under different conditions, in different locations and even from different parts of a plant. Techniques such as Gas Chromatography (GC) and High Performance Liquid Chromatography (HPLC) are definitely very accurate for a single measurement but they have the following drawbacks:
· They are more expensive
· They take 30-45 minutes
· Require highly trained personnel
· They destroy the sample
· The solutions used need to be discarded and can potentially pollute the
environment
On the other hand, the intrinsic variability of potency throughout a plant, requires one to measure the potency many times and at different locations of the plant such that averaging can be done and a more realistic result of potency can be obtained. This is not possible with analytical techniques and hence scientists have turned to near IR spectroscopy that can perform the measurements much faster (1-2 minutes). Although accuracy is far less than analytical techniques, one can compensate for lower accuracy by doing multiple measurements and averaging.
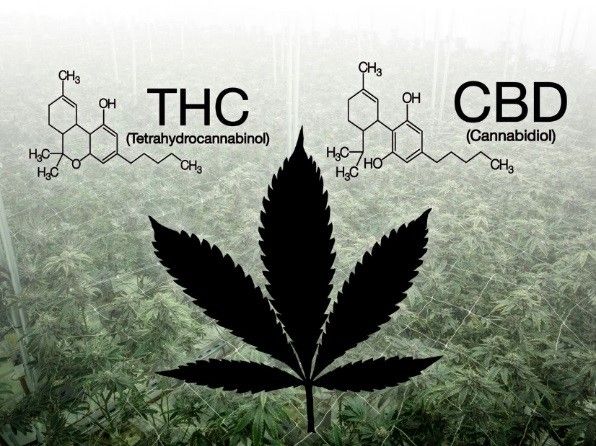
Figure 1 shows a typical cannabis flower

Figure 1: A typical cannabis flower contains CBD and THC
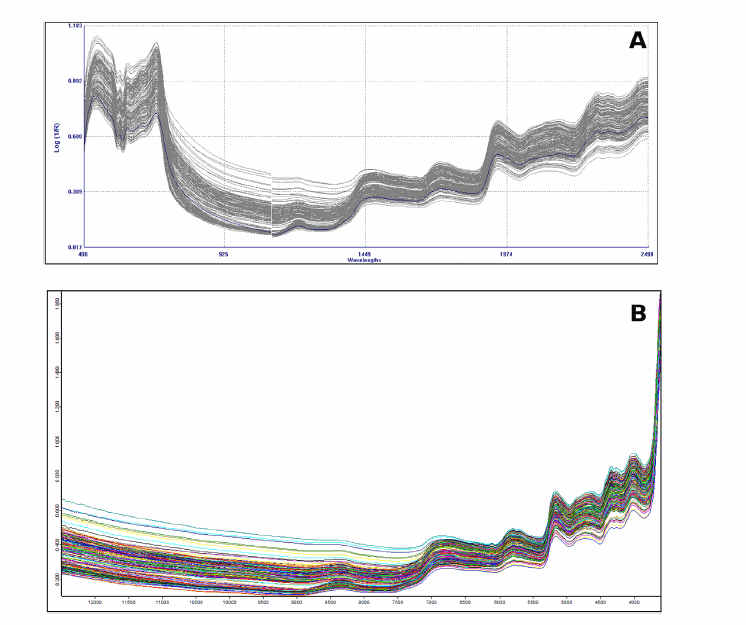
As shown in figure 1, determination of CBD and THC involves absorption of light by many CH bonds. A near IR spectrometer is very capable of measuring the overtones of CH bond in the near IR region. Using NIR spectroscopy, scientists can correlate the strength of an absorption band to the quantity of ingredient that needs to be measured. Figure 2 shows the Near IR spectrum of cannabis using two instruments, a dispersive NIR instrument and a FT-NIR instrument [reference 1]

Figure 2: Near IR measurement of spectra for Cannabis [Ref 1]
The dispersive instrument measured the reflectance spectrum in the range 400-2498 nm and the FT-NIR instrument measured in the range 800 to 2500 nm (12500 cm-1 to 4000 cm-1). Both instrument show similar features including absorption peaks where their spectral range overlap. Of note are water absorption bands at 1450 nm and 1930 nm which are overtones of the OH bond. Since the samples were grounded and dried, these bands must have been due to residual water left in the plant. Other important features of the plant such as lipids (around 1730 nm and 2310 nm), Protein (around 2100 nm) and aromatic hydrocarbons at 1666 nm can be observed as well.
The near IR method has the following advantages over the analytical methods:
· The measurement takes only a few minutes rather than hours
· The samples are not destroyed
· Personnel with minimum training can handle the work
However, they have the following disadvantages:
and GC.
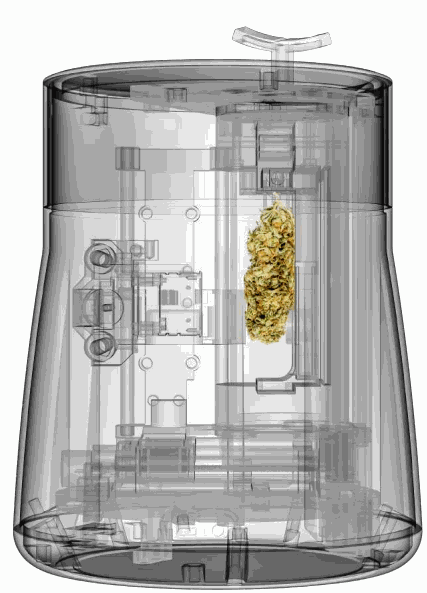
Near IR instruments often require the samples to be grounded and dried before the measurements are carried out. However, some cannabis specific instruments measure the potency from the flower itself. In these instruments, a large gold reflector is used and multiple detectors measure the reflected spectra from various surfaces and then the results are averaged. By using machine learning algorithm and visual analysis of the plant the accuracy can be highly improved. Figure 3 shows the cannabis plant mounted in one of these instruments offered by Gemmacert and distributed by Allied Scientific Pro

Figure 3: Mounted cannabis plant in a near IR spectrometer (Ref 2)
This method ensures the plant from a batch is not destroyed by the grinding and drying processes and can still be used in its original form.
As mentioned, the correlation of spectral data to the absorption bands is a necessity for the NIR spectrometers to provide a reasonable solution for the variability of potency in cannabis plant. Statistical techniques such as Principle Component Analysis (PCA) and Partial Least Square (PLS) are integral in the software of cannabis analyzers. These statistical methods allow the scientists to come up with a calibration equation that will be used to quantify the potency of the cannabis plant.
Allied Scientific Pro distributes a cannabis analyser that measures the potency (THC and CBD) of the plant in the flower form without the need for grinding and drying. For more information please refer to he following link:
The methodology of quantifying cannabis using NIR technique is no trivial task but has taken giant strides in recent years to replace the cumbersome, expensive and slow analytical techniques. The fast speed has allowed for many measurements to be done in a short time and averaging of the results have compensated for lower accuracy. Even doing many measurements in NIR will take less time as compared to one measurement for analytical techniques. There is no need to do sample preparation. The final result is a cheaper solution at high quality and faster speed of measurement.
References:
1- The potential of near infrared spectroscopy to estimate the content of cannabinoids in Cannabis sativa L: A comparative study, C.Sanches-Carnerero Callado et.al, Talanta 190 (2018).
2- GemmaCert website (https://gemmacert. com/).