With the growth of cannabis industry and legalization of it in many countries such as Canada, Netherlands, Spain, etc. and some states of USA such as Oregon, California and Colorado, the need for quantification of cannabinoids such as THC and CBD in Cannabis has become more in demand. Analytical techniques such as Gas Chromatography (GC) and High-Performance Liquid Chromatography are all very expensive, require sample preparation, take time and in the process destroy the sample. For this reason, Near IR spectroscopy has emerged as a power method to monitor Cannabis quality and quantify THC, CBD and other ingredients of cannabis by measuring their absorption spectra. Chemometric models are developed from these sets of spectra which are called calibration models. The calibration models are applied to a set of validation spectra to determine the accuracy of prediction. If this accuracy is suitable, the model can be applied to unknown samples and make a prediction of their THC and CBD.
Figure 1 shows the trichomes on the cannabis plant which contain a liquid full of cannabinoids.
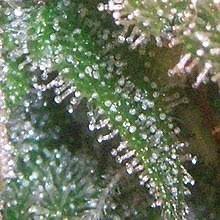
Figure 1: Trichomes in a cannabis plant
This technote focuses on four aspects of the Near IR technique of measuring Cannabis which are as follows
Differences between grinding and whole flower methods
Water activity and moisture content
Spectral features of Cannabis in near IR
Batching
Differences between grinding and whole flower methods
When it comes to measuring the spectral characteristics of the cannabis sample, one could either grind it or measure it as the full flower. There are different types of instruments for these two different styles of measurement. For example, the beacon analyzer by Sage Analytics (Distributed by Allied Scientific Pro) requires the samples to be grinded to a fine powder and be placed in the sample chamber. Figure 2 shows the beacon analyzer.
![]()
Figure 2: Beacon analyzer requires sample to be grinded
On the other hand, there are other analyzers that measure THC and CBD in the flower form. For these analyzers, the flower is mounted at the central part of the instrument and is rotated. Several imaging cameras take pictures of the trichomes and also a spectrometer measures the reflectance spectra from different angles. Instrument’s software will correlate the spectra and the images to come up with an average THC/CBD measurement. Figure 3 shows the Gemmacert spectrometer that measures the flower as a whole1,2 .

Figure 3: Gemmacert measures the flower as a wholer
Water activity and moisture content
The amount of moisture in a Cannabis plant affects the storage conditions of the plant. A cannabis plant with too much water could run the risk of mold infection and if there is too little water in it, there will be a loss of potency. Trichomes become fragile and breakdown causing loss of cannabinoids and terpenes. The moisture is measured in terms of water activity in certain instruments which analyze the sample as a plant sample without grinding. Although moisture content defines the amount of water present in the plant, the water activity defines how the water in the plant reacts with the micro-organisms such as mold and bacteria. The higher the water activity, the faster micro-organisms such as mold, yeast and bacteria are able to grow, and this results in higher and more strict standards for storage. At this point it is necessary to define the water activity (Aw). The water activity is defined as the ratio of vapour pressure in food to the vapour pressure of pure water3
Water activity = P / Po
Where P is the vapour pressure in food and P0 is the vapour pressure of pure water.
The water pressure is closely related to the moisture content which is defined as
Where w is the wet weight, d is the fry weight and MC is the moisture content.
Here are the moisture contents of a few food items
| Food | Moisture content | Food | Moisture content |
| Apple | 84 | Cucumbers | 96 |
| Orange | 87 | Patato | 79 |
| Grapes | 81 | Pepper | 92 |
| Strawbery | 92 | Beef (raw) | 73 |
| Broccoli | 91 | Chicken (raw) | 69 |
When you measure water activity, you are in fact measuring the excess of water in a food item that can be used by micro-organism. Table 2 classifies different water activities leading to emergence of different microorganisms.
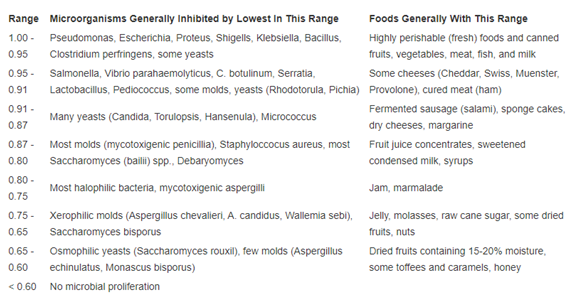
Table 2: Water activity and the corresponding vulnerability to microorganisms3
For cannabis, the best water activity is in the range 0.6 to 0.85. Lower than this range, the flower will lose potency and the leaves break. Higher than this range, the flower is susceptible to mold infection.
Spectral features of cannabis in near IR
Several bands of importance can be named in the NIR spectra of cannabis4
OH groups, mostly present in the water, manifests themselves in the form of 1450 and 1930 nm overtones and combination bands.
As as lipids are concerned, their associated bands can be found around 1210 nm (second overtone of stretching vibrations), 1730 and 1760 nm (first overtone of stretching vibrations), and around 2310 and 2350 nm (combination of stretching and bending vibrations) of -CH2 and -CH3 functional groups.
Bands observed at 2058 and 2166 nm have been associated with absorption of protein, and the ones observed at around 2078–2110 nm and 2268 nm are related to fiber content. The band observed at 1666 nm corresponds to aromatic hydrocarbons of the Cannabis terpenes (first overtone of CH stretching). This band is more visible in samples with more than 4% CBD content.
Figures 4 and 5 show the near-IR absorption spectrum of Cannabis in the ranges 900-1700 nm and 1350-2150 nm measured with the NIRvascan spectrometer (Offered by Allied Scientific Pro, refer to the link at the end of the article) in the standard and extended ranges respectively

Figure 4: Near-IR measurement of Cannabis in the range 900-1700 nm
Figure 5: Near-IR measurement of Cannabis in the range 1350-2150 nm
Batching
It is always beneficial to characterize a cannabis batch along the supply chain which means that the batch attributes, such as the average and variance of the batch needs to be estimated. Presently, these attributes include the total THC, the total CBD and the water activity. Thus, it makes sense to quantify how many samples are needed to be analyzed to characterize a batch. There are many factors that can affect plant’s potency aside from genetics of the plant. These could include the watering frequency, temperature, the type of soil and the nutrients used. Even choosing a seasonable time could make a difference between the potency of the same cultivars. With a spectroscopy-based analyzer, one may analyze more samples compared to analytical/chemical lab methods. Segmenting a harvest into many batches, makes it easier to producing more homogenous batches and results in a more accurate average assessment1 .
Allied Scientific Pro offers a near-IR cannabis analyzer and a near-IR spectrometer working in the range 1350-2150 nm for the on-the-spot analysis of cannabis potency. Please refer to following links for further information:
https://www.alliedscientificpro . com / nirvascan#models
References:
System and method for qualifying plant material, Yarden et.al, US patent, 10.458,908 B2, October 29,2019
Testing quality and potency of plant material, Yarden et.al, US patent, Pub no: US/2020/0333242/A1, Pub date: Oct 22, 2020
The potential of near infrared spectroscopy to estimate the content of cannabinoids in Cannabis sativa L: A comparative study, C.Sanches-Carnerero Callado et.al, Talanta 190 (2018).