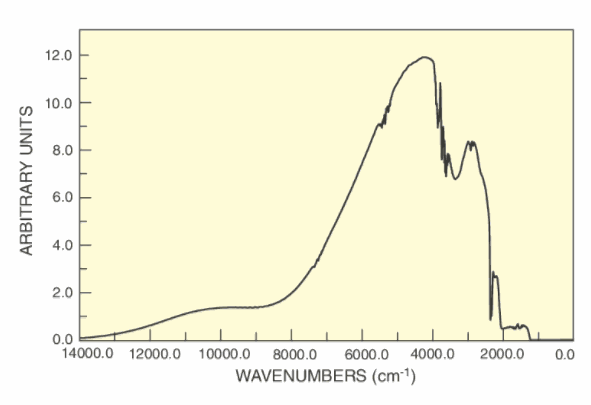
The goal of this article is to compare the near IR spectroscopic technique with FT-IR and FT-NIR methods. Molecular spectroscopy is the study of interaction of Electromagnetic waves with matter. Molecular bonds are capable of rotation and vibration which include bending and stretching. When an electromagnetic wave of appropriate energy level is impingent on a molecule, the energy is absorbed and the molecule starts to vibrate. Since all the fundamental vibrations of the molecules lie in the mid-IR region (between 2.5 m to 25 m), the absorption peaks are much stronger for the Mid-IR spectroscopic techniques as compared to NIR spectroscopic methods (in the range 780nm to 2.5 m) which utilizes overtones and combination bands. Figure 1 below shows the overtones and fundamental frequencies for a molecule.
Figure 1: The first and second overtone, fall in the near IR region (1515 nm and 1010 nm), whereas the third overtone falls in the deep red region (757 nm).
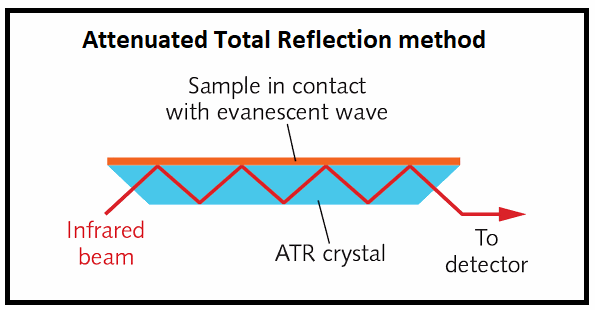
In principle, there are two ways which spectroscopic methods use to probe a material. In one method, called the dispersive method, individual wavelengths which are produced by shining a broadband source on a diffraction grating or a prism are impingent on a material and absorption at each wavelength is measured. Near Infra-red diffuse reflectance method utilizes this technique. In the second method, the full beam of the broad-band source shines on the input of an interferometer where the sample whose absorption is to be measured is placed in one arm. The interferometer consists of a stationary mirror and a moving mirror and the scanning is done through the movement of the moving mirror. An interference pattern is hence recorded whose Fourier transform regenerates the spectral signal. The same measurement is done without the presence of the absorption material in one arm and by dividing the former by the latter, an absorption spectrum for the material is generated. Both FT-IR and FT-NIR utilize this method. Figure 2 shows the interferometer for a FT-IR method:
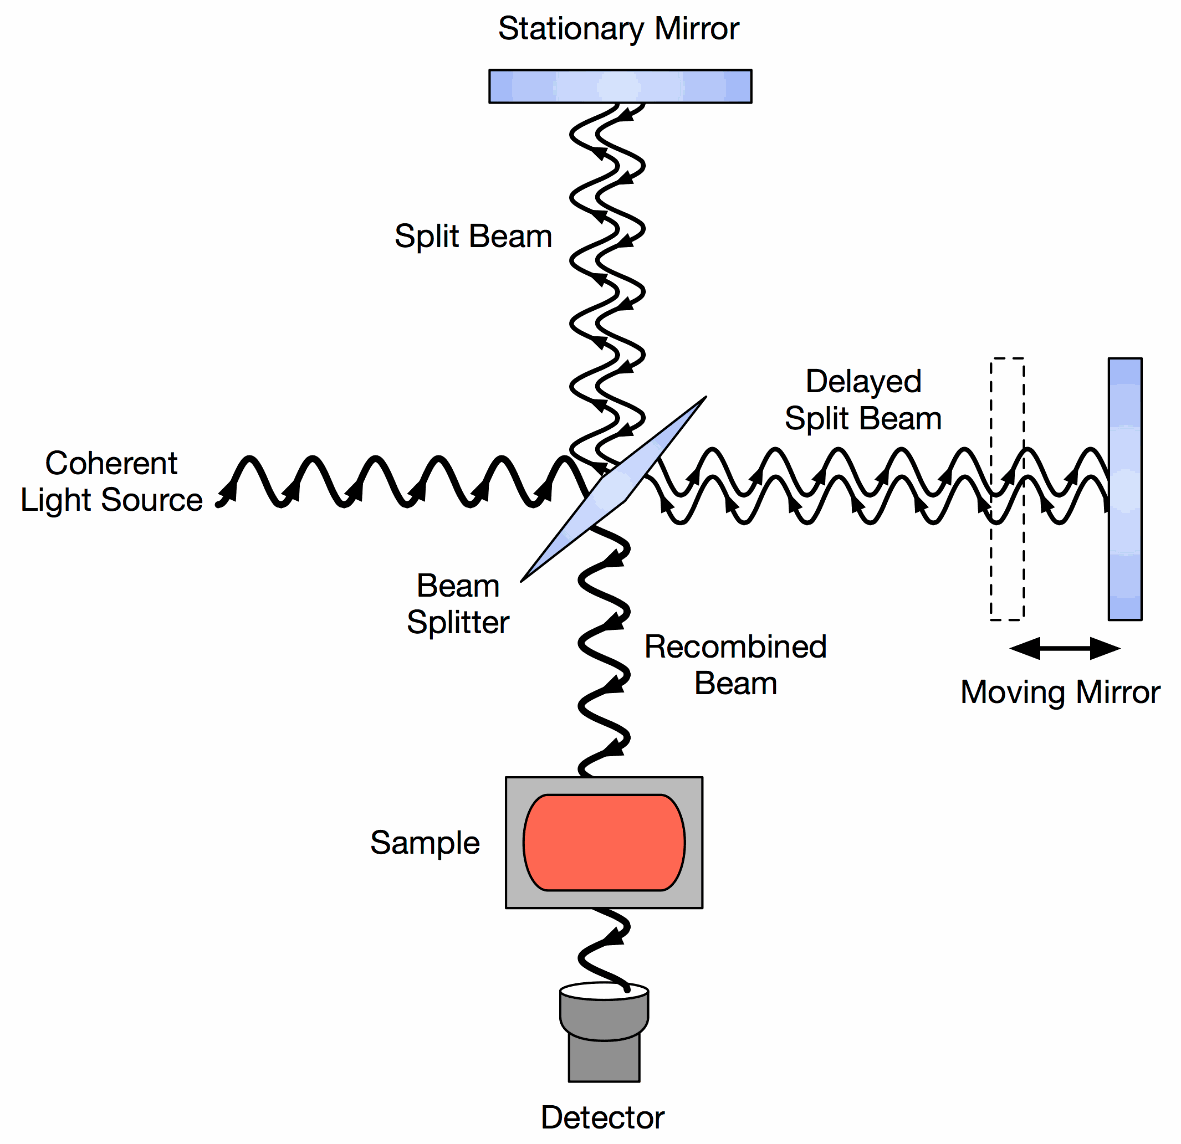
Figure 2: Construction of an FTIR spectrometer