TM-30-18 technote
An earlier technote described TM-30-15 technical memorandum and its advantages over the CIE colour rendering method [Reference 1, Reference 2].
Over the course of the last year, IES’s colour committee has made some changes to this memorandum to make it more compatible with CIE standards.
Three changes were made to the TM-30-15 and the new memorandum was published under the name TM-30-18. The changes are as follows:
1- For colour samples with no data outside the range of 400-700 nm, the extrapolation
method was changed from a logarithm-based extrapolation to a flat extrapolation.
Figure 1 shows the difference between the two
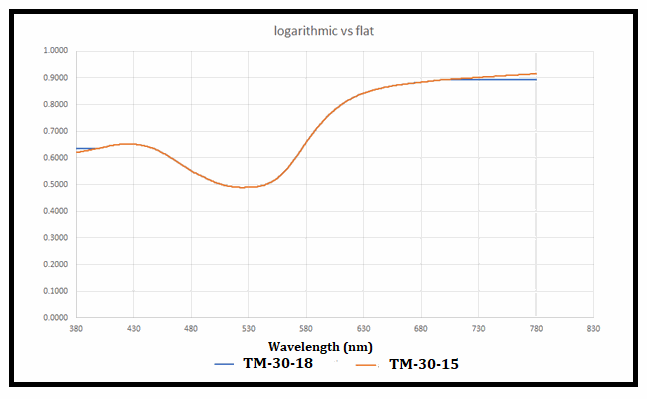
Figure 1: Shows flat extrapolation (blue curve, TM-30-18) vs. Logarithmic extrapolation (Orange curve, TM-30-15) for a Colour Evaluation Sample.
There was no natural colour data for some of the samples outside the 400-700 nm and the reflectance functions had to be extrapolated.
In the flat extrapolation , the end values are repeated in the range 380-400 nm and 700-780 nm. This change was brought about because CIE preferred flat
extrapolation and the goal was to bring the CIE and IES standards closer.
2- The range encompassing the blended reference changed from 4501-
5499 K to 4001-4999 K [Reference 3].
In TM-30-15 the rule was to use a blackbody source of the same temperature as the source when the source temperature was below 4500 K, a blended CIE daylight and black body source for the range 4501-5499 K and a CIE daylight source for CCT above 5500 K. The temperature range of the blended source has now been lowered to 4001-4999 K. Below 4000 K, a blackbody source of the same temperature is used and above 5000 K, a CIE day light source will be used. Figure 2 shows a CIE daylight source spectrum.
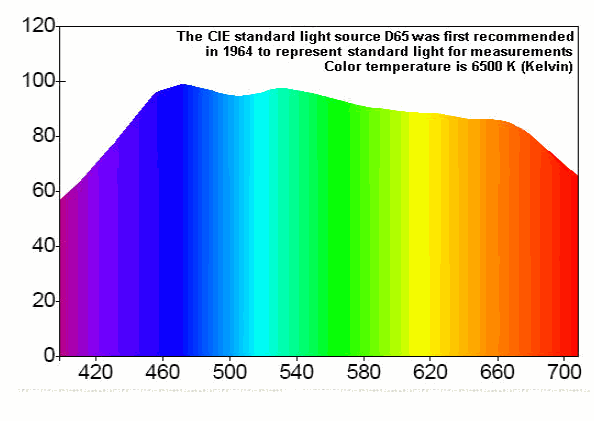
Figure 2: CIE Day Light source spectrum
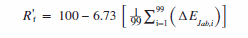
In TM-30-15 the Euclidean distance DEi was calculated for each Colour Evaluation Sample (CES), averaged out for 99 colors and the color rendering index Rf was calculated using the following equation for that particular color.
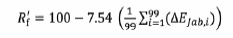
The scaling factor has now changed to 6.73 such that the fidelity calculations are now closer to the fidelity values calculated by CIE. Figure 3 shows the Euclidean distance error maps for each 99 colour.
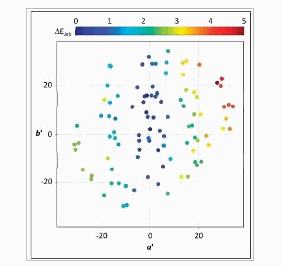
Figure 3: Euclidean distance error map
Therefore the new formula is:
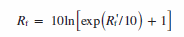
As in the case of TM-30-15, the scale has to be adjusted so that the fidelity index does NOT produce negative numbers and the minimum value would be zero. The transformation is shown below:
The above three changes summarizes the modifications brought about new TM-30-18 standard. The benefit of these changes is to bring the CIE and IES standard closer together.
Allied Scientific Pro that offers the lighting passport will be incorporating TM-30-18 in them in near future.
References:
1-
The Development of the IES method
for evaluating colour rendition of
light sources, David A, et.al, Optics
Express23(12): 15888-15906
2-
IES TM-30-15, IES method for
evaluating light source colour rendition,
David A. et.al, Illuminating
Engineering Society (2015)
3-
Royer MP. What is the Reference? An
examination of alternatives to
the reference sources used in IES TM-30-15.
Leukos. 2016; 13:71-89